Tulsa Real Estate Market Statistics: May 2016 Inventory Analysis for the Tulsa MLS
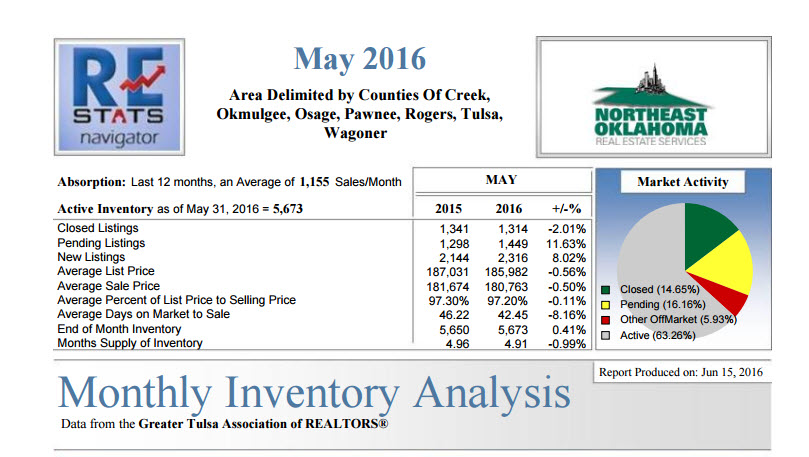
Tulsa Real Estate Market Statistics: May 2016 Inventory Analysis for the Tulsa MLS — Report dated June 15, 2016.
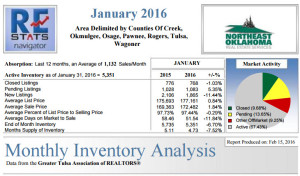
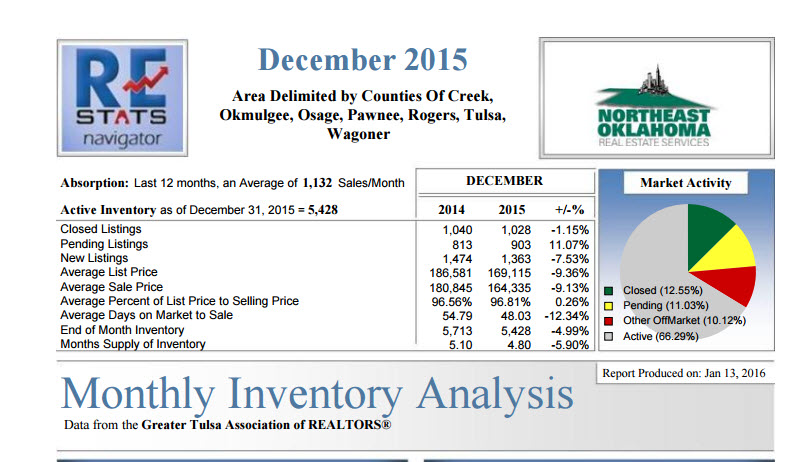
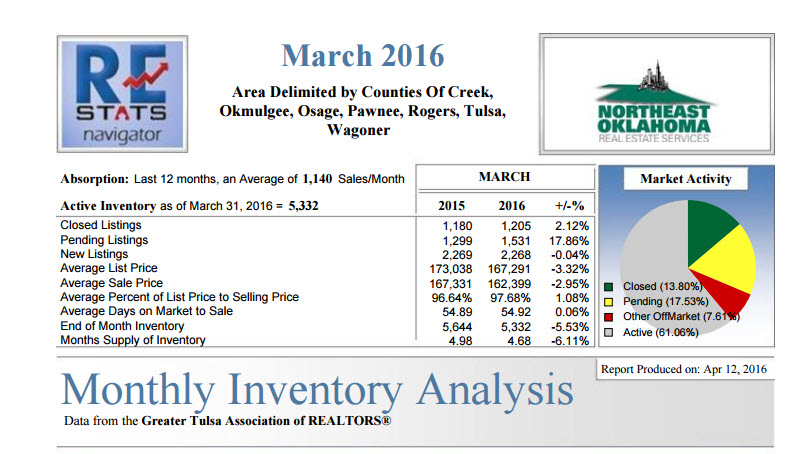
Tulsa Real Estate Market Inventory Analysis
 May 2016 MSA Average / May 2016 Tulsa Housing Stats
Tulsa Real Estate Market Inventory Analysis for the Tulsa MSA during May 2016 indicates the market is beginning to loosen up as inventory expands slightly since last month. Over the past year, our inventory of homes for sale has increased just slightly. Average sales price has decreased and the cumulative days on market has lengthened since last month. Since last year the average sales price has decreased, while the average days on market to sale has also decreased.
From data provided by the Greater Tulsa Association (the Tulsa MLS) the following statistics were compiled by RE STATS Inc. for the Area delimited by the following Northeast Oklahoma counties:
- Creek County
- Okmulgee County
- Osage County
- Pawnee County
- Rogers County
- Tulsa County
- Wagoner County
Quick Summary
Absorption: Last 12 months an average of 1,155 sales per month
Active Inventory: As of May 31, 2016 = 5,673
Closed Listings: 1,314 (down 2.01% below a year ago)
Pending Listings: 1,449 (up 11.63% above a year ago)
New Listings: 2,316 (up 8.02% above a year ago)
Average List Price: $185,982 (down 0.56% below a year ago)
Average Sale Price: $180,763 (down 0.50% below a year ago)
Average Percent of List Price to Selling Price: 97.20% (down 0.11% below a year ago)
Average Days on Market to Sale: 42.45 days (down 8.16% above a year ago)
End of Month Inventory: 5,673 (down 0.41% below a year ago)
Months Supply of Inventory: 4.91 months (down 0.99% below a year ago)
Analysis Wrap Up
Months Supply of Inventory (MSI) Decreases
The total housing inventory at the end of May 2016 rose 0.41% to 5,673 existing homes available for sale. Over the last 12 months this area has had an average of 1,155 closed sales per month. This represents an unsold inventory index of 4.91 MSI for this period.
Average Sale Prices Falling
According to the preliminary trends, this market area has experienced some downward momentum with the decline of Average Price this month. Prices dipped 0.50% in May 2016 compared to $180,763 versus the previous year at $181,674.
Average Days on Market Shortens
The average number of 42.45 days that homes spent on the market before selling decreased by 3.77 days or 8.16% in May 2016 compared to last year’s same month at 46.22 DOM.
Sales Success for May 2016 is Positive
Overall, with Average Prices falling and Days on Market decreasing, the Listed versus Closed Ratio finished weak this month.
There were 2,316 New Listings in May 2016, up 8.02% from last year at 2,144. Furthermore, there were 1,314 Closed Listings this month versus last year at 1,341, a 2.01%decrease.
Closed versus Listed trends yielded a 56.7% ratio, down from last year’s May 2016 at 62.5%, a 9.29% downswing. This will certainly create pressure on an increasing Month’s Supply of Inventory (MSI) in the following months to come.
Here is the full report:
If you want to see specific market share information for your midtown Tulsa neighborhood or subdivision, contact Debbie Solano at 918-724-8201.
Get Shortlink: http://midtowntulsarealestate.net/?p=1148
————————————————————–Copyright© 2016 by Debbie Solano — ALL RIGHTS RESERVED — Midtown Tulsa Real Estate — Tulsa Real Estate Market Statistics: May 2016 Inventory Analysis for the Tulsa MLS

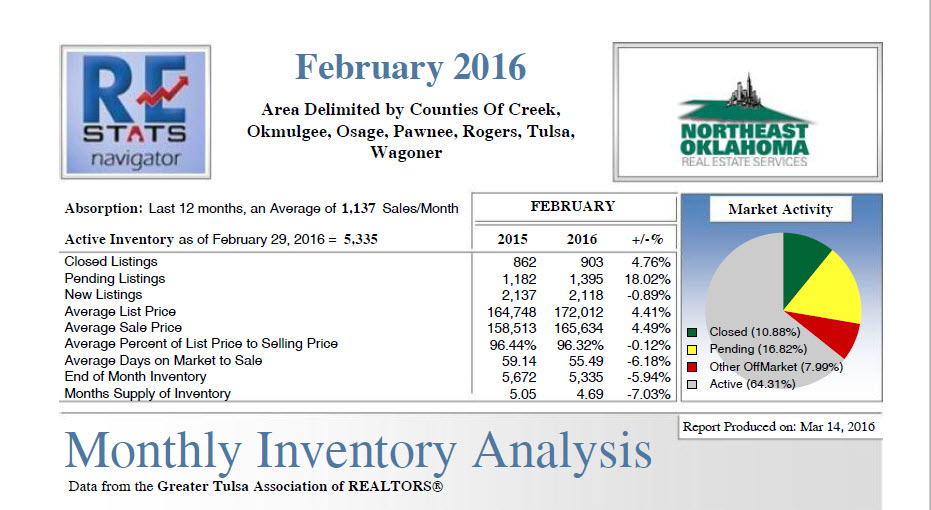
 Feb2016MSAAverage