


Debris Removal Options and Cooling Station Locations
Neighborhood Liaison Jhoanna Murray from Working in Neighborhoods Department (WIN)
Citizens that were affected by the storm and need to dispose of greenwaste can call the City of Tulsa for a bulky waste pick-up or utilize the City of Tulsa’s Mulch Site. The Mulch Site hours will be extended this weekend for citizens.
The City of Tulsa Mulch Site is free for Tulsa residents. Yard waste can be dropped off at the City Mulch Facility, 2100 N. 145th E. Ave. this weekend from 7:30 a.m. – 7:30 p.m. The normal schedule for the Mulch Site is 7:30 a.m. – 5 p.m. Participants must show a current City of Tulsa utility bill or a driver’s license with a Tulsa address.
Bulky Waste Collection is available for Tulsa residents that need to dispose of large items (including large tree limbs). There is a $10 collection fee per collection with a pre-set volume of eight cubic yards or approximately the size of a small vehicle such as a Volkswagen Beetle. Call (918) 596-9777 to schedule a bulky waste collection.
This weekend, inspectors will be assessing neighborhoods located in the city of Tulsa from 51st St. to the south and from the Arkansas River to the east reaching the Tulsa city limits. The majority of the damage reported was located in the southeast quadrant of the City and inspectors will decide if any other measures are warranted.
Residents that do not fall within the identified boundaries and believe their neighborhood should be assessed can call (918) 596-9777.
Cooling Stations
Citizens without power can visit any of the three cooling stations:
Tulsa County Social Services Cooling Station
2401 Charles Page Blvd.
Tulsa OK 74127
8:30 a.m. – 8 p.m.
Dennis R. Neill Equality Center
621 East 4th Street
Tulsa, OK 74120
Noon to 9 p.m. 7-days a week
John 3:16 Mission
506 N. Cheyenne
Tulsa, Okla. 74103
24/7
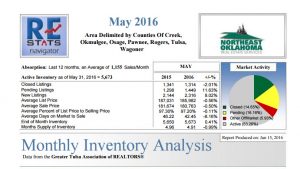 May 2016 MSA Average / May 2016 Tulsa Housing Stats
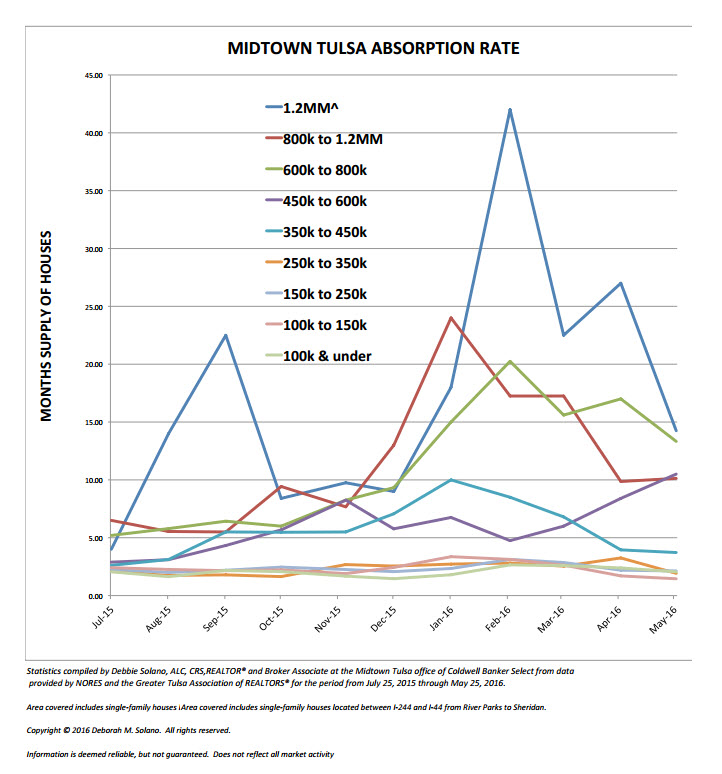 Midtown Tulsa Absorption Rate Graph for May 25, 2016
 April 2016 MSA Average / April 2016 Tulsa Housing Stats
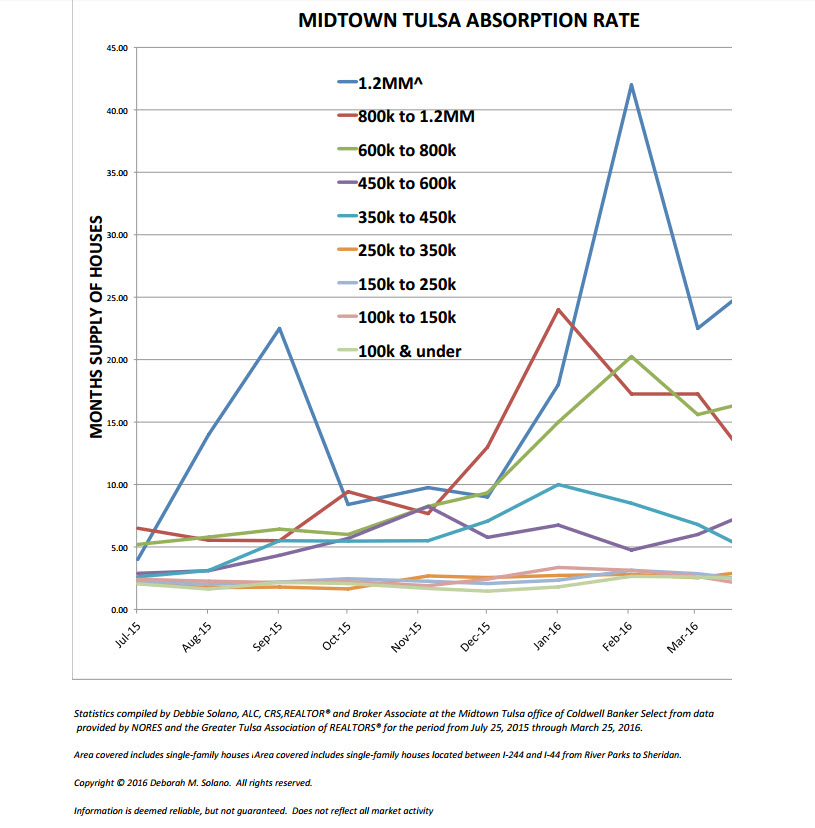 Midtown Tulsa Absorption Rate Graph for April 25, 2016
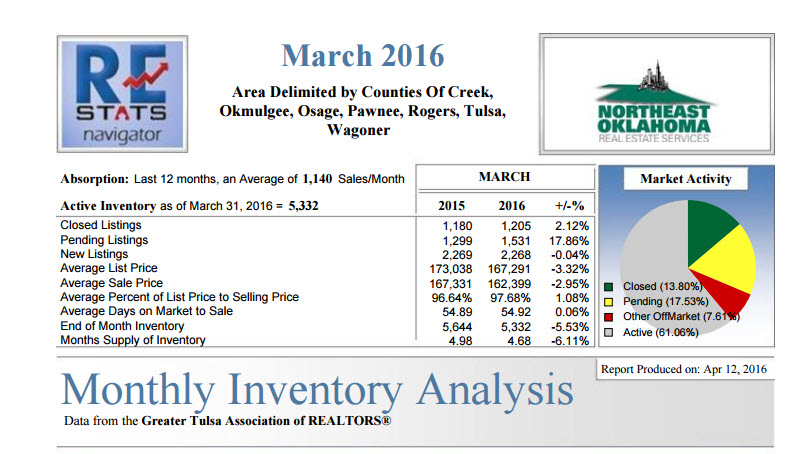 March2016MSAAverage
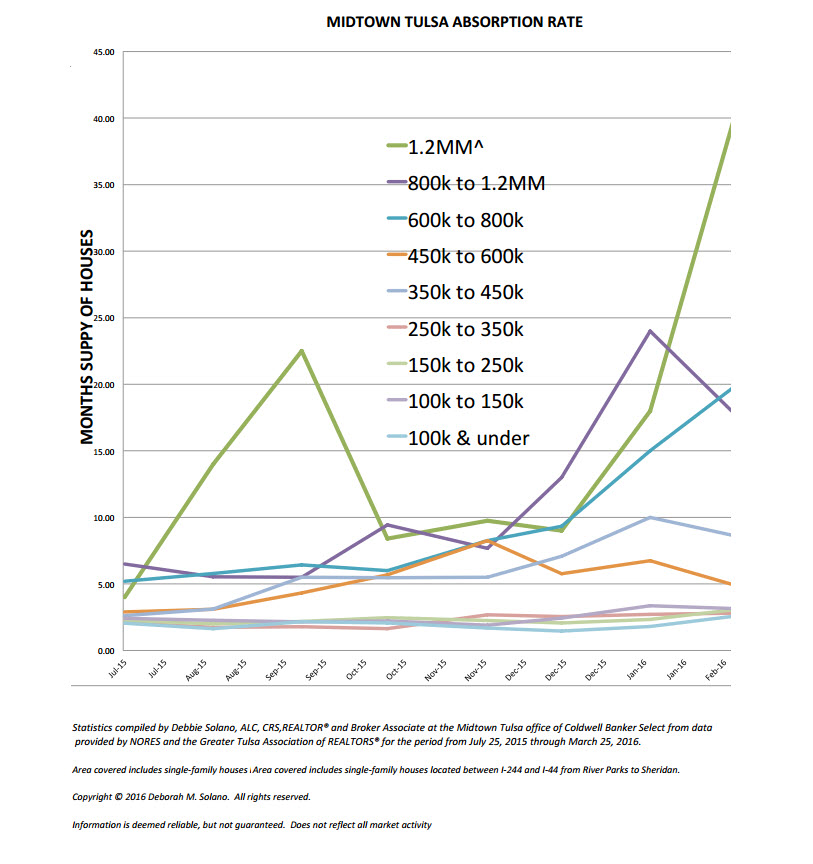 Midtown Tulsa Absorption Rate Graph for March 25, 2016
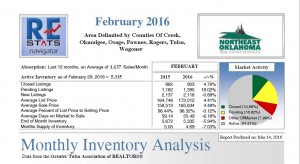 Feb2016MSAAverage