From the monthly archives: "April 2016"

Here are the market statistics for the three-month period from January 25, 2016 to April 25, 2016.

Compare these statistics with previous months’ statistics and see the trends for yourself.
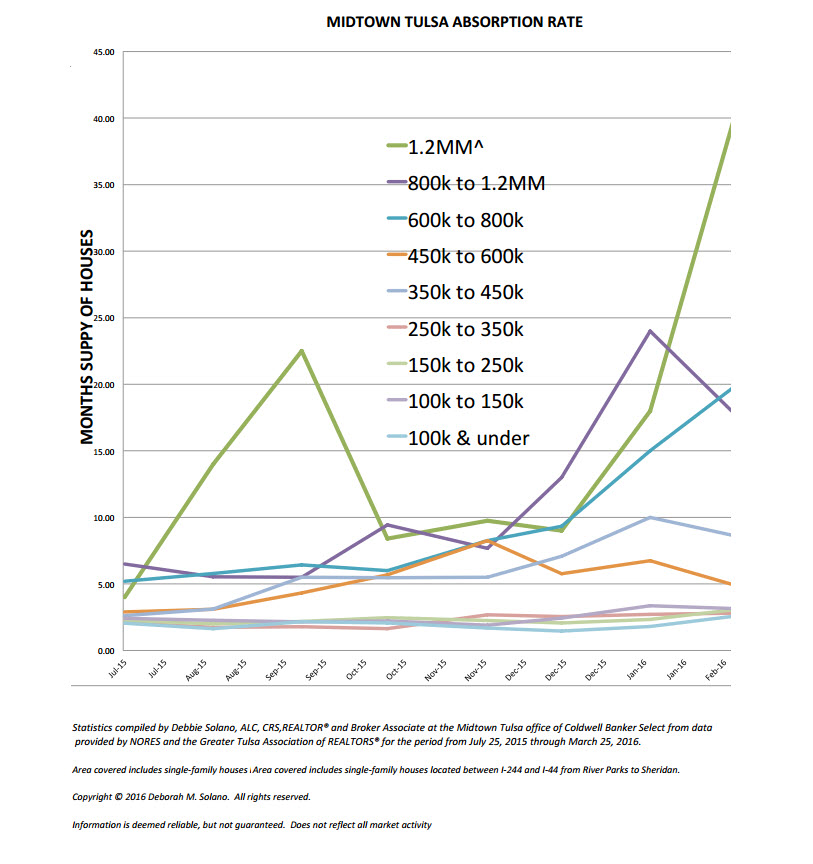
Midtown Tulsa Absorption Rate Graph for April 25, 2016Midtown Tulsa Absorption Rate Graph for April 25, 2016

Midtown Tulsa Real Estate Sales Statistics for Homes Sold by Price Point

(for the three-month period from January 25, 2016 to April 25, 2016)

Here are the latest market statistics for Midtown Tulsa.

Overall Average

Average Number of Bedrooms: 3
Average Number of Full Bathrooms: 2
Average Number of Half Bathrooms: 0
Average Number of Garage Spaces: 2
Median Year Built: 1950
Average Square Footage (heated space): 1,802
Average Acreage: 0.24
Average List Price: $224,487.00
Average List Price Per Square Foot: $124.58
Average Sales Price: $214,398.00
Average Sales Price Per Square Foot: $118.98
Average Sales Price to List Price Ratio: 96.18%
Average Cumulative Days on Market: 61
Months Supply of Homes: 3.16
Odds of Selling in 90 Days: 29.35%

Up to $100,000

Average Number of Bedrooms: 2
Average Number of Full Bathrooms: 1
Average Number of Half Bathrooms: 0
Average Number of Garage Spaces: 1
Median Year Built: 1947
Average Square Footage (heated space): 1,128
Average Acreage: 0.19
Average List Price: $73,289.00
Average List Price Per Square Foot: $64.97
Average Sales Price: $68,158.00
Average Sales Price Per Square Foot: $60.42
Average Sales Price to List Price Ratio: 93.14%
Average Cumulative Days on Market: 54
Months Supply of Homes: 2.39
Odds of Selling in 90 Days: 39.33%

$100,000 to $150,000

Average Number of Bedrooms: 3
Average Number of Full Bathrooms: 1
Average Number of Half Bathrooms: 0
Average Number of Garage Spaces: 1
Median Year Built: 1952
Average Square Footage (heated space): 1,414
Average Acreage: 0.20
Average List Price: $125,186.00
Average List Price Per Square Foot: $88.53
Average Sales Price: $122,153.00
Average Sales Price Per Square Foot: $86.39
Average Sales Price to List Price Ratio: 97.64%
Average Cumulative Days on Market: 48
Months Supply of Homes: 1.70
Odds of Selling in 90 Days: 38.82%

$150,000 to $250,000

Average Number of Bedrooms: 3
Average Number of Full Bathrooms: 2
Average Number of Half Bathrooms: 0
Average Number of Garage Spaces: 2
Median Year Built: 1946
Average Square Footage (heated space): 1,811
Average Acreage: 0.23
Average List Price: $197,125.00
Average List Price Per Square Foot: $108.85
Average Sales Price: $190,586.00
Average Sales Price Per Square Foot: $105.24
Average Sales Price to List Price Ratio: 97.18%
Average Cumulative Days on Market: 56
Months Supply of Homes: 2.19
Odds of Selling in 90 Days: 29.63%

$250,000 to $350,000

Average Number of Bedrooms: 3
Average Number of Full Bathrooms: 2
Average Number of Half Bathrooms: 0
Average Number of Garage Spaces: 2
Median Year Built: 1949
Average Square Footage (heated space): 2,163
Average Acreage: 0.24
Average List Price: $306,029.00
Average List Price Per Square Foot: $141.48
Average Sales Price: $294,521.00
Average Sales Price Per Square Foot: $136.16
Average Sales Price to List Price Ratio: 96.40%
Average Cumulative Days on Market: 56
Months Supply of Homes: 3.25
Odds of Selling in 90 Days: 28.92%

$350,000 to $450,000

Average Number of Bedrooms: 4
Average Number of Full Bathrooms: 2
Average Number of Half Bathrooms: 1
Average Number of Garage Spaces: 2
Median Year Built: 1947
Average Square Footage (heated space): 2,603
Average Acreage: 0.24
Average List Price: $403,664.00
Average List Price Per Square Foot: $155.08
Average Sales Price: $388,717.00
Average Sales Price Per Square Foot: $149.33
Average Sales Price to List Price Ratio: 96.40%
Average Cumulative Days on Market: 107
Months Supply of Homes: 3.95
Odds of Selling in 90 Days: 24.72%

$450,000 to $600,000

Average Number of Bedrooms: 3
Average Number of Full Bathrooms: 2
Average Number of Half Bathrooms: 1
Average Number of Garage Spaces: 2
Median Year Built: 1957
Average Square Footage (heated space): 3,110
Average Acreage: .33
Average List Price: $517,920.00
Average List Price Per Square Foot: $166.53
Average Sales Price: $496,830.00
Average Sales Price Per Square Foot: $159.75
Average Sales Price to List Price Ratio: 95.98%
Average Cumulative Days on Market: 110
Months Supply of Homes: 8.40
Odds of Selling in 90 Days: 16.95%

$600,000 to $800,000

Average Number of Bedrooms: 4
Average Number of Full Bathrooms: 4
Average Number of Half Bathrooms: 1
Average Number of Garage Spaces: 2
Median Year Built: 1970
Average Square Footage (heated space): 4,082
Average Acreage: 0.59
Average List Price: $712,000.00
Average List Price Per Square Foot: $174.42
Average Sales Price: $684,250.00
Average Sales Price Per Square Foot: $167.63
Average Sales Price to List Price Ratio: 96.06%
Average Cumulative Days on Market: 110
Months Supply of Homes: 17.00
Odds of Selling in 90 Days: 8.7%

$800,000 to $1,200,000

Average Number of Bedrooms: 4
Average Number of Full Bathrooms: 4
Average Number of Half Bathrooms: 1
Average Number of Garage Spaces: 3
Median Year Built: 2015
Average Square Footage (heated space): 6,415
Average Acreage: 0.75
Average List Price: $1,017,271
Average List Price Per Square Foot: $158.58
Average Sales Price: $935,553.00
Average Sales Price Per Square Foot: $145.84
Average Sales Price to List Price Ratio: 92.85%
Average Cumulative Days on Market: 98
Months Supply of Homes: 9.86
Odds of Selling in 90 Days: 13.21%

Above $1,200,000

Average Number of Bedrooms: 4
Average Number of Full Bathrooms: 4
Average Number of Half Bathrooms: 2
Average Number of Garage Spaces: 3
Median Year Built: 1984
Average Square Footage (heated space): 5,423
Average Acreage: 0.65
Average List Price: $1,610,000.00
Average List Price Per Square Foot: $296.88
Average Sales Price: $1,437,500.00
Average Sales Price Per Square Foot: $265.07
Average Sales Price to List Price Ratio: 89.53%
Average Cumulative Days on Market: 31
Months Supply of Homes: 27.00
Odds of Selling in 90 Days: 6.90%

Statistics compiled by Debbie Solano, ALC, CRS, from data provided by NORES and the Greater Tulsa Association of REALTORS® for the period from January 25, 2016 through April 25, 2016.

Area covered includes single-family houses located between I-244 and I-44 from River Parks to Sheridan.

Information is deemed reliable, but not guaranteed. Does not reflect all market activity.

Get Shortlink: http://midtowntulsarealestate.net/?p=1053
________________________________________________________________________
Debbie Solano is an Accredited Land Consultant and Certified Residential Specialist with a Broker-Associate license which hangs at the Midtown Tulsa office of Coldwell Banker Select REALTORS®. She would enjoy your feedback or questions. She can be reached at 918-724-8201 or dsolano@cbTulsa.com.

Copyright © 2016 by Deborah M. Solano — ALL RIGHTS RESERVED — Midtown Tulsa Real Estate — Midtown Tulsa Real Estate Market Statistics: April 2016

Tulsa Real Estate Market Statistics: March 2016 Inventory Analysis for the Tulsa MLS — Report dated April 12, 2016.

Tulsa Real Estate Market Inventory Analysis

March 2016 MSA AverageMarch2016MSAAverage

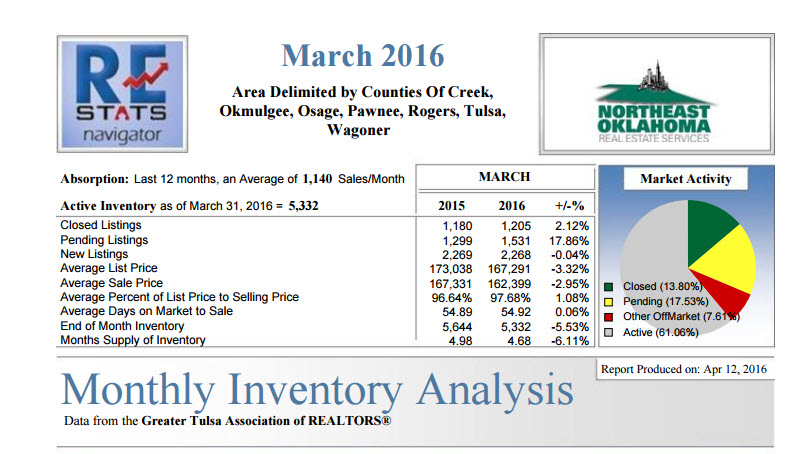
Tulsa Real Estate Market Inventory Analysis for the Tulsa MSA during March 2016 indicates the market is continuing to tighten up as inventory shrinks. However, average sales price has decreased and the cumulative days on market has lengthened.

From data provided by the Greater Tulsa Association (the Tulsa MLS) the following statistics were compiled by RE STATS Inc. for the Area delimited by the following Northeast Oklahoma counties:

  • Creek County
  • Okmulgee County
  • Osage County
  • Pawnee County
  • Rogers County
  • Tulsa County
  • Wagoner County

Quick Summary

Absorption: Last 12 months an average of 1,140 sales per month

Active Inventory: As of March 31, 2016 = 5,332

Closed Listings: 1,205 (up 2.12% above a year ago)

Pending Listings: 1,531 (up 17.86% over a year ago)

New Listings: 2,268 (down 0.04% below a year ago)

Average List Price: $167,291 (down 3.32% below a year ago)

Average Sale Price: $162,399 (down 2.95% below a year ago)

Average Percent of List Price to Selling Price: 97.68% (up 1.08% above a year ago)

Average Days on Market to Sale: 54.92 days (down 0.06% above a year ago)

End of Month Inventory: 5,332 (down 5.53% below a year ago)

Months Supply of Inventory: 4.68 months (down 6.11% below a year ago)

Analysis Wrap Up

Months Supply of Inventory (MSI) Decreases

The total housing inventory at the end of March 2016 decreased 5.53% to 5,332 existing homes available for sale. Over the last 12 months this area has had an average of 1,140 closed sales per month. This represents an unsold inventory index of 4.68 MSI for this period.

Average Sale Prices Falling

According to the preliminary trends, this market area has experienced some downward momentum with the decline of Average Price this month. Prices dropped 2.95% in March 2016 compared to $162,399 versus the previous year at $167,331.

Average Days on Market Lengthens

The average number of 54.92 days that homes spent on the market before selling increased by 0.03 days or 0.06% in March 2016 compared to last year’s same month at 54.89 DOM.

Sales Success for March 2016 is Positive

Overall, with Average Prices falling and Days on Market increasing, the Listed versus Closed Ratio finished strong this month.

There were 2,268 New Listings in March 2016, down 0.04% from last year at 2,269. Furthermore, there were 1,205 Closed Listings this month versus last year at 1,180, a 2.12%increase.

Closed versus Listed trends yielded a 53.1% ratio, up from last year’s March 2016 at 52.0%, a 2.16% upswing. This will certainly create pressure on a decreasing Month’s Supply of Inventory (MSI) in the following months to come.

Here is the full report:

March2016MSAAverage

If you want to see specific market share information for your midtown Tulsa neighborhood or subdivision, contact Debbie Solano at 918-724-8201.

Get Shortlink: http://midtowntulsarealestate.net/?p=1038
————————————————————–

Copyright© 2016 by Debbie Solano — ALL RIGHTS RESERVED — Midtown Tulsa Real Estate — Tulsa Real Estate Market Statistics: March 2016 Inventory Analysis for the Tulsa MLS

Here are the market statistics for the three-month period from December 25, 2015 to March 25, 2016.

Compare these statistics with previous months’ statistics and see the trends for yourself.

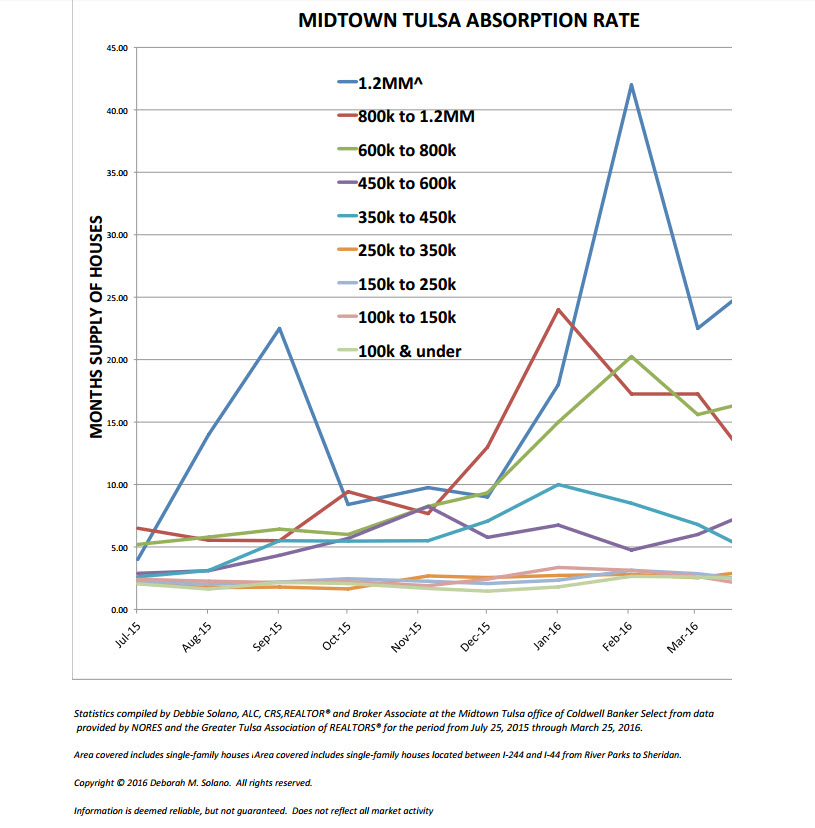
Midtown Tulsa Absorption Rate Graph for March 25, 2016Midtown Tulsa Absorption Rate Graph for March 25, 2016

Midtown Tulsa Real Estate Sales Statistics for Homes Sold by Price Point

(for the three-month period from December 25, 2015 to March 25, 2016)

Here are the latest market statistics for Midtown Tulsa.

Overall Average

Average Number of Bedrooms: 3
Average Number of Full Bathrooms: 2
Average Number of Half Bathrooms: 0
Average Number of Garage Spaces: 2
Median Year Built: 1950
Average Square Footage (heated space): 1,807
Average Acreage: 0.24
Average List Price: $224,459.00
Average List Price Per Square Foot: $124.22
Average Sales Price: $217,558.00
Average Sales Price Per Square Foot: $120.40
Average Sales Price to List Price Ratio: 96.94%
Average Cumulative Days on Market: 54
Months Supply of Homes: 3.79
Odds of Selling in 90 Days: 34.19%

Up to $100,000

Average Number of Bedrooms: 2
Average Number of Full Bathrooms: 1
Average Number of Half Bathrooms: 0
Average Number of Garage Spaces: 1
Median Year Built: 1947
Average Square Footage (heated space): 1,207
Average Acreage: 0.20
Average List Price: $70,736.00
Average List Price Per Square Foot: $58.60
Average Sales Price: $66,806.00
Average Sales Price Per Square Foot: $55.35
Average Sales Price to List Price Ratio: 94.46%
Average Cumulative Days on Market: 36
Months Supply of Homes: 2.59
Odds of Selling in 90 Days: 38.35%

$100,000 to $150,000

Average Number of Bedrooms: 3
Average Number of Full Bathrooms: 1
Average Number of Half Bathrooms: 0
Average Number of Garage Spaces: 1
Median Year Built: 1952
Average Square Footage (heated space): 1,413
Average Acreage: 0.20
Average List Price: $124,585.00
Average List Price Per Square Foot: $88.17
Average Sales Price: $122,007.00
Average Sales Price Per Square Foot: $86.35
Average Sales Price to List Price Ratio: 98.08%
Average Cumulative Days on Market: 47
Months Supply of Homes: 2.63
Odds of Selling in 90 Days: 32.27%

$150,000 to $250,000

Average Number of Bedrooms: 3
Average Number of Full Bathrooms: 2
Average Number of Half Bathrooms: 0
Average Number of Garage Spaces: 2
Median Year Built: 1945
Average Square Footage (heated space): 1,735
Average Acreage: 0.22
Average List Price: $208,526.00
Average List Price Per Square Foot: $120.19
Average Sales Price: $199,710.00
Average Sales Price Per Square Foot: $115.11
Average Sales Price to List Price Ratio: 96.58%
Average Cumulative Days on Market: 51
Months Supply of Homes: 2.86
Odds of Selling in 90 Days: 29.58%

$250,000 to $350,000

Average Number of Bedrooms: 3
Average Number of Full Bathrooms: 2
Average Number of Half Bathrooms: 0
Average Number of Garage Spaces: 2
Median Year Built: 1942
Average Square Footage (heated space): 2,171
Average Acreage: 0.23
Average List Price: $301,852.00
Average List Price Per Square Foot: $139.04
Average Sales Price: $289,473.00
Average Sales Price Per Square Foot: $133.34
Average Sales Price to List Price Ratio: 97.27%
Average Cumulative Days on Market: 52
Months Supply of Homes: 2.54
Odds of Selling in 90 Days: 32.91%

$350,000 to $450,000

Average Number of Bedrooms: 4
Average Number of Full Bathrooms: 2
Average Number of Half Bathrooms: 1
Average Number of Garage Spaces: 2
Median Year Built: 1946
Average Square Footage (heated space): 2,600
Average Acreage: 0.21
Average List Price: $409,120.00
Average List Price Per Square Foot: $157.35
Average Sales Price: $396,852.00
Average Sales Price Per Square Foot: $152.64
Average Sales Price to List Price Ratio: 97.10%
Average Cumulative Days on Market: 90
Months Supply of Homes: 6.80
Odds of Selling in 90 Days: 18.75%

$450,000 to $600,000

Average Number of Bedrooms: 3
Average Number of Full Bathrooms: 2
Average Number of Half Bathrooms: 1
Average Number of Garage Spaces: 2
Median Year Built: 1962
Average Square Footage (heated space): 3,142
Average Acreage: .35
Average List Price: $531,291.00
Average List Price Per Square Foot: $169.09
Average Sales Price: $507,209.00
Average Sales Price Per Square Foot: $161.43
Average Sales Price to List Price Ratio: 95.56%
Average Cumulative Days on Market: 106
Months Supply of Homes: 6.00
Odds of Selling in 90 Days: 19.64%

$600,000 to $800,000

Average Number of Bedrooms: 4
Average Number of Full Bathrooms: 3
Average Number of Half Bathrooms: 1
Average Number of Garage Spaces: 2
Median Year Built: 1961
Average Square Footage (heated space): 3,856
Average Acreage: 0.59
Average List Price: $710,500.00
Average List Price Per Square Foot: $184.26
Average Sales Price: $684,900.00
Average Sales Price Per Square Foot: $177.62
Average Sales Price to List Price Ratio: 96.40%
Average Cumulative Days on Market: 81
Months Supply of Homes: 15.60
Odds of Selling in 90 Days: 8.47%

$800,000 to $1,200,000

Average Number of Bedrooms: 5
Average Number of Full Bathrooms: 4
Average Number of Half Bathrooms: 2
Average Number of Garage Spaces: 3
Median Year Built: 1980
Average Square Footage (heated space): 6,415
Average Acreage: 1.01
Average List Price: $1,062,250
Average List Price Per Square Foot: $165.59
Average Sales Price: $945,000.00
Average Sales Price Per Square Foot: $147.31
Average Sales Price to List Price Ratio: 89.88%
Average Cumulative Days on Market: 168
Months Supply of Homes: 17.25
Odds of Selling in 90 Days: 9.09%

Above $1,200,000

Average Number of Bedrooms: 4
Average Number of Full Bathrooms: 4
Average Number of Half Bathrooms: 2
Average Number of Garage Spaces: 3
Median Year Built: 1973
Average Square Footage (heated space): 5,882
Average Acreage: 0.87
Average List Price: $1,672,500.00
Average List Price Per Square Foot: $284.34
Average Sales Price: $1,832,700.00
Average Sales Price Per Square Foot: $311.58
Average Sales Price to List Price Ratio: 106.99%
Average Cumulative Days on Market: 75
Months Supply of Homes: 22.50
Odds of Selling in 90 Days: 8.00%

Statistics compiled by Debbie Solano, ALC, CRS, from data provided by NORES and the Greater Tulsa Association of REALTORS® for the period from December 25, 2015 through March 25, 2016.

Area covered includes single-family houses located between I-244 and I-44 from River Parks to Sheridan.

Information is deemed reliable, but not guaranteed. Does not reflect all market activity.

Get Shortlink: http://midtowntulsarealestate.net/?p=1019
________________________________________________________________________
Debbie Solano is an Accredited Land Consultant and Certified Residential Specialist with a Broker-Associate license which hangs at the Midtown Tulsa office of Coldwell Banker Select REALTORS®. She would enjoy your feedback or questions. She can be reached at 918-724-8201 or dsolano@cbTulsa.com.

Copyright © 2016 by Deborah M. Solano — ALL RIGHTS RESERVED — Midtown Tulsa Real Estate — Midtown Tulsa Real Estate Market Statistics: March 2016