Midtown Tulsa Real Estate Market Statistics: May 2016
Here are the market statistics for the three-month period from February 25, 2016 to May 25, 2016.
Compare these statistics with previous months’ statistics and see the trends for yourself.
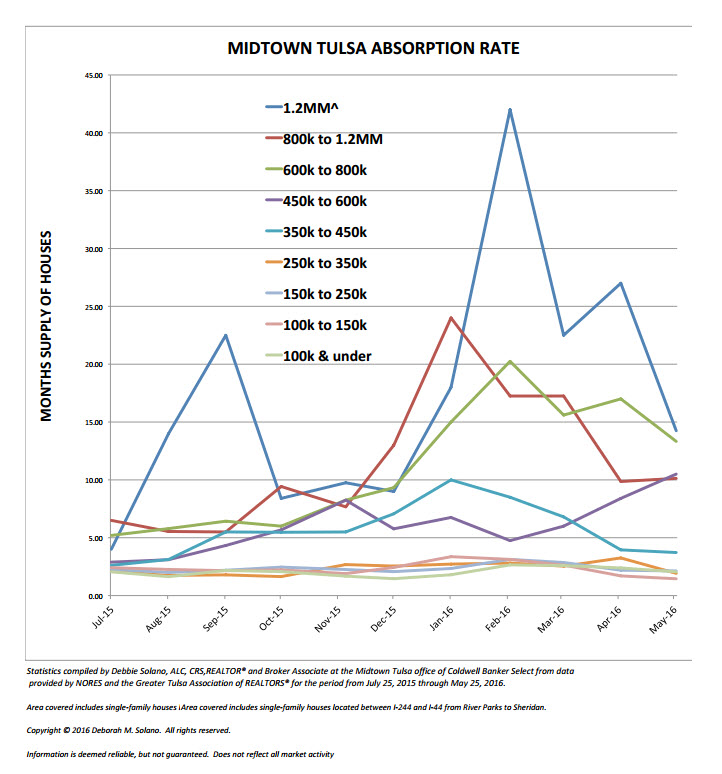
Midtown Tulsa Absorption Rate Graph for May 25, 2016
Midtown Tulsa Real Estate Sales Statistics for Homes Sold by Price Point
(for the three-month period from February 25, 2016 to May 25, 2016)
Here are the latest market statistics for Midtown Tulsa.
Overall Average
Average Number of Bedrooms: 3
Average Number of Full Bathrooms: 2
Average Number of Half Bathrooms: 0
Average Number of Garage Spaces: 1
Median Year Built: 1950
Average Square Footage (heated space): 1,817
Average Acreage: 0.25
Average List Price: $233,446.00
Average List Price Per Square Foot: $128.48
Average Sales Price: $225,065.00
Average Sales Price Per Square Foot: $123.87
Average Sales Price to List Price Ratio: 96.65%
Average Cumulative Days on Market: 57
Months Supply of Homes: 2.79
Odds of Selling in 90 Days: 32.94%
Up to $100,000
Average Number of Bedrooms: 2
Average Number of Full Bathrooms: 1
Average Number of Half Bathrooms: 0
Average Number of Garage Spaces: 1
Median Year Built: 1945
Average Square Footage (heated space): 1,102
Average Acreage: 0.19
Average List Price: $78,273.00
Average List Price Per Square Foot: $71.03
Average Sales Price: $73,572.00
Average Sales Price Per Square Foot: $66.76
Average Sales Price to List Price Ratio: 93.78%
Average Cumulative Days on Market: 62
Months Supply of Homes: 2.05
Odds of Selling in 90 Days: 40.38%
$100,000 to $150,000
Average Number of Bedrooms: 3
Average Number of Full Bathrooms: 1
Average Number of Half Bathrooms: 0
Average Number of Garage Spaces: 1
Median Year Built: 1952
Average Square Footage (heated space): 1,390
Average Acreage: 0.20
Average List Price: $125,814.00
Average List Price Per Square Foot: $90.51
Average Sales Price: $122,967.00
Average Sales Price Per Square Foot: $88.47
Average Sales Price to List Price Ratio: 97.78%
Average Cumulative Days on Market: 40
Months Supply of Homes: 1.45
Odds of Selling in 90 Days: 43.88%
$150,000 to $250,000
Average Number of Bedrooms: 3
Average Number of Full Bathrooms: 2
Average Number of Half Bathrooms: 0
Average Number of Garage Spaces: 2
Median Year Built: 1943
Average Square Footage (heated space): 1,792
Average Acreage: 0.24
Average List Price: $198,536.00
Average List Price Per Square Foot: $110.79
Average Sales Price: $192,044.00
Average Sales Price Per Square Foot: $107.17
Average Sales Price to List Price Ratio: 97.15%
Average Cumulative Days on Market: 54
Months Supply of Homes: 2.13
Odds of Selling in 90 Days: 36.32%
$250,000 to $350,000
Average Number of Bedrooms: 3
Average Number of Full Bathrooms: 2
Average Number of Half Bathrooms: 0
Average Number of Garage Spaces: 2
Median Year Built: 1948
Average Square Footage (heated space): 2,229
Average Acreage: 0.26
Average List Price: $310,322.00
Average List Price Per Square Foot: $139.22
Average Sales Price: $300,928.00
Average Sales Price Per Square Foot: $135.01
Average Sales Price to List Price Ratio: 97.10%
Average Cumulative Days on Market: 47
Months Supply of Homes: 1.92
Odds of Selling in 90 Days: 39.13%
$350,000 to $450,000
Average Number of Bedrooms: 3
Average Number of Full Bathrooms: 2
Average Number of Half Bathrooms: 1
Average Number of Garage Spaces: 2
Median Year Built: 1950
Average Square Footage (heated space): 2,660
Average Acreage: 0.29
Average List Price: $407,920.00
Average List Price Per Square Foot: $153.35
Average Sales Price: $392,363.00
Average Sales Price Per Square Foot: $147.50
Average Sales Price to List Price Ratio: 96.27%
Average Cumulative Days on Market: 103
Months Supply of Homes: 3.72
Odds of Selling in 90 Days: 26.60%
$450,000 to $600,000
Average Number of Bedrooms: 4
Average Number of Full Bathrooms: 3
Average Number of Half Bathrooms: 1
Average Number of Garage Spaces: 2
Median Year Built: 1952
Average Square Footage (heated space): 3,446
Average Acreage: .37
Average List Price: $508,100.00
Average List Price Per Square Foot: $146.60
Average Sales Price: $490,375.00
Average Sales Price Per Square Foot: $141.48
Average Sales Price to List Price Ratio: 96.66%
Average Cumulative Days on Market: 94
Months Supply of Homes: 10.50
Odds of Selling in 90 Days: 13.11%
$600,000 to $800,000
Average Number of Bedrooms: 4
Average Number of Full Bathrooms: 4
Average Number of Half Bathrooms: 1
Average Number of Garage Spaces: 2
Median Year Built: 1958
Average Square Footage (heated space): 4,082
Average Acreage: 0.70
Average List Price: $694,056.00
Average List Price Per Square Foot: $170.03
Average Sales Price: $677,278.00
Average Sales Price Per Square Foot: $165.92
Average Sales Price to List Price Ratio: 97.5%
Average Cumulative Days on Market: 87
Months Supply of Homes: 13.33
Odds of Selling in 90 Days: 11.39%
$800,000 to $1,200,000
Average Number of Bedrooms: 4
Average Number of Full Bathrooms: 4
Average Number of Half Bathrooms: 1
Average Number of Garage Spaces: 3
Median Year Built: 2007
Average Square Footage (heated space): 4,667
Average Acreage: 0.31
Average List Price: $1,018,350
Average List Price Per Square Foot: $218.20
Average Sales Price: $977,859.00
Average Sales Price Per Square Foot: $209.53
Average Sales Price to List Price Ratio: 96.28%
Average Cumulative Days on Market: 80
Months Supply of Homes: 10.13
Odds of Selling in 90 Days: 14.04%
Above $1,200,000
Average Number of Bedrooms: 5
Average Number of Full Bathrooms: 5
Average Number of Half Bathrooms: 2
Average Number of Garage Spaces: 3
Median Year Built: 1955
Average Square Footage (heated space): 5,953
Average Acreage: 1.01
Average List Price: $1,542,500.00
Average List Price Per Square Foot: $259.11
Average Sales Price: $1,431,250.00
Average Sales Price Per Square Foot: $240.42
Average Sales Price to List Price Ratio: 93.30%
Average Cumulative Days on Market: 174
Months Supply of Homes: 14.25
Odds of Selling in 90 Days: 11.43%
Statistics compiled by Debbie Solano, ALC, CRS, from data provided by NORES and the Greater Tulsa Association of REALTORS® for the period from February 25, 2016 through May 25, 2016.
Area covered includes single-family houses located between I-244 and I-44 from River Parks to Sheridan.
Information is deemed reliable, but not guaranteed. Does not reflect all market activity.
Get Shortlink: http://midtowntulsarealestate.net/?p=1123
________________________________________________________________________
Debbie Solano is an Accredited Land Consultant and Certified Residential Specialist with a Broker-Associate license which hangs at the Midtown Tulsa office of Coldwell Banker Select REALTORS®. She would enjoy your feedback or questions. She can be reached at 918-724-8201 or dsolano@cbTulsa.com.
Copyright © 2016 by Deborah M. Solano — ALL RIGHTS RESERVED — Midtown Tulsa Real Estate — Midtown Tulsa Real Estate Market Statistics: May 2016